A key component of any R&D Productivity measure is generally associated with cost. As such, it is fundamental to understand how much it costs to pursue any given drug development project whether it be internally, with a co-development partner or as part of a licensing or acquisition deal. KMR Group has worked with companies to devise a reliable, robust, and systemic way to extract the cost incurred for each project in your portfolio using a top-down approach making the final figures appropriate and comparable for benchmarking, forecasting, and planning or to calculate the full cost of drug development
Yearly Archives: 2016
Outsourcing Performance
Evaluates the impact of CRO performance across the entire clinical trial spectrum including key processes such as study startup, site selection, country selection and cycle time
Project Cost Study

Compares and analyzes project cost in a manner that is consistent and reliable, and explores the factors that influence it, with a high degree of confidence and in a manner that is transparent
Project Cost Metrix
By pooling data beyond what any company could gather and analyze on its own, the application gives users reliable comparisons of the cost for any given phase of development across projects, by project characteristic (e.g., Alzheimer’s), and normalized by factors known to be statistically significant in driving cost (e.g., patients, molecule size). The application provides the basis for enhanced project and portfolio planning and more effective decisions
NextGEN SITE SCORECARD
- Site Selection
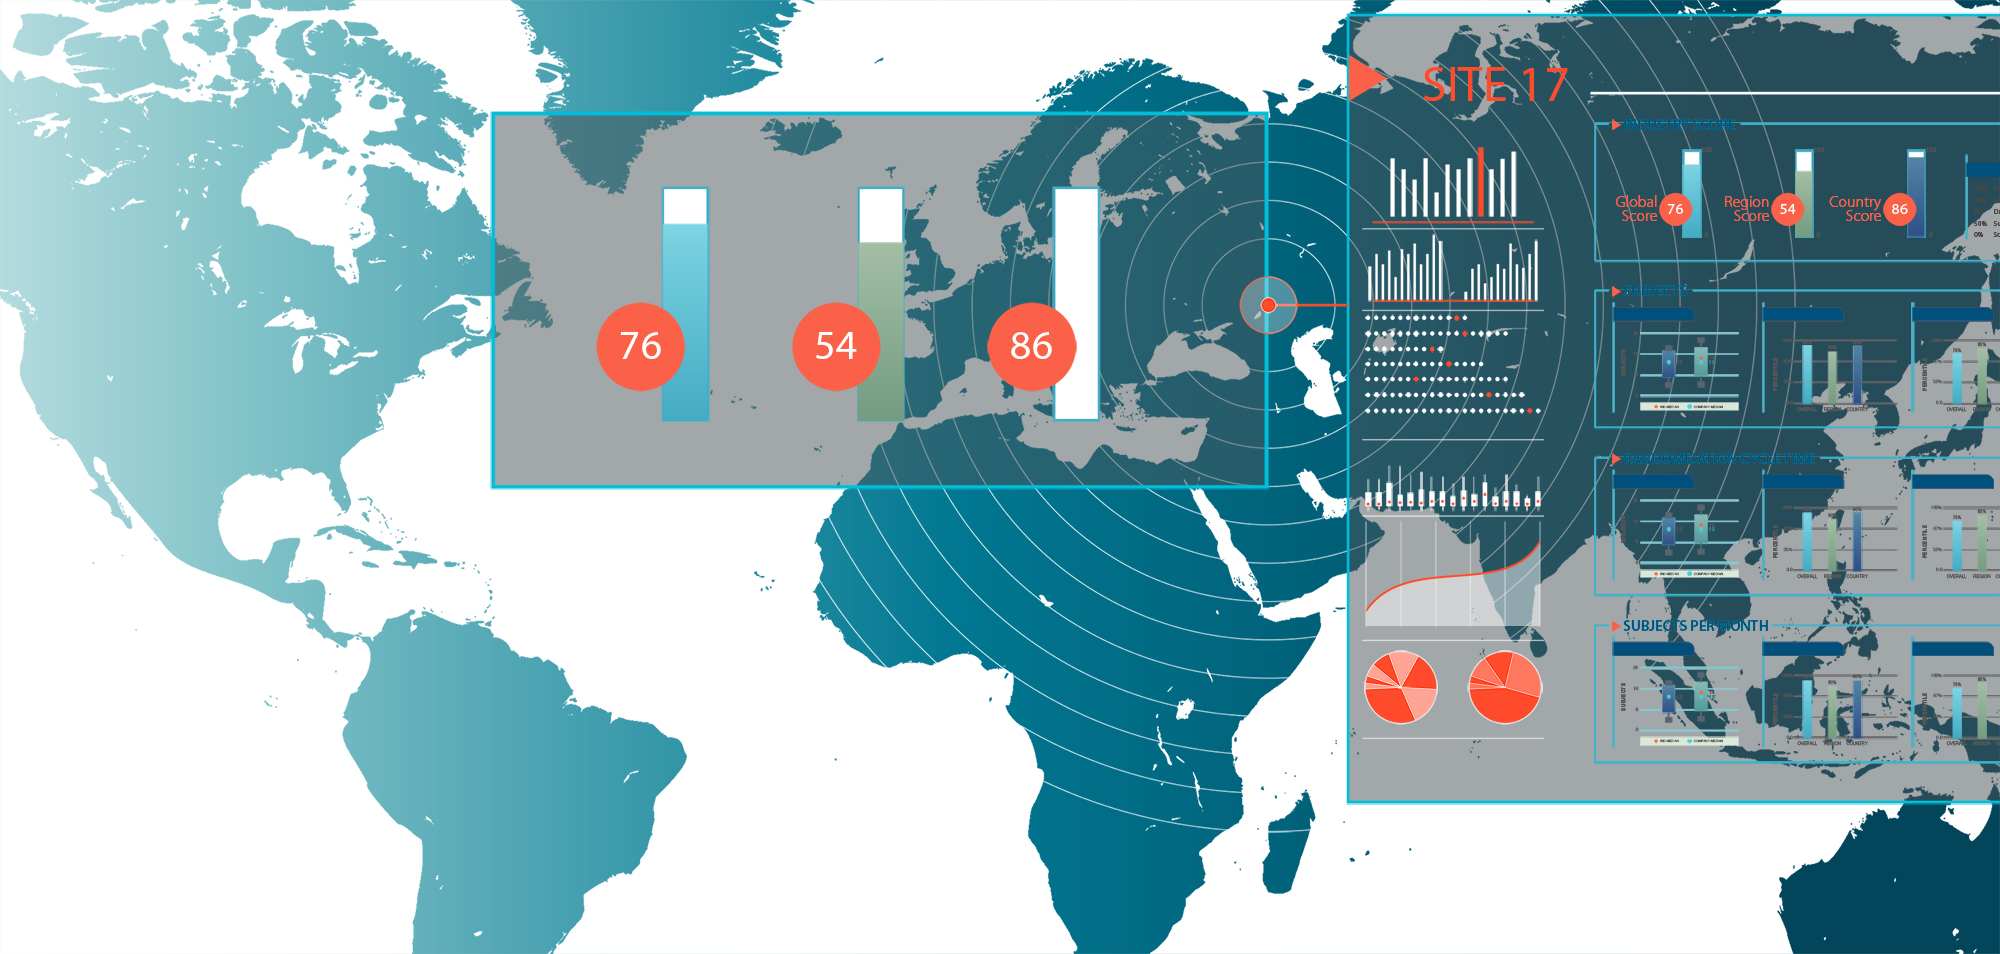
Named site performance benchmarks and site ranks by country, region and global for use in site selection, feasibility, site planning, contract negotiation and site engagement
Includes
- Proprietary KMR 5 Star site ranking system
- Named site performance benchmarks
- Site performance rankings at the global, region and country level
- Site performance metrics on site start-up, enrollment and retention
- Performance based scorecards for each site by TA or disease
Site Metrix

Site benchmarks for planning, forecasting, and country selection
Includes
 Study Start-up Metrics
 IRB Decision Metrics
 Site Screening Metrics
 Site Enrollment Metrics
Site Contracts
Site contract cycle time benchmarks to help inform companies on the time it takes to get a site ready to enroll and highlights these differences across companies, site type, disease, geography and outsourcing
- Disease
- Phase
- Outsourcing
- Geography
- Negotiations, Deadlines, Payments
- Master Agreements
Site Performance Study

This initiative will assess the performance of study sites and the factors that drive this, among them being trial design, and also behaviors of key stakeholders – namely, the Site, the Sponsor, and when applicable the CRO. The Study will evaluate how different behaviors in combination with other factors can drive better recruitment performance
Site Metrix for Sites
Peer rankings and benchmarks in the following areas:
- Phase
- Geography
- Site Type
- Disease
- IRB Metrics
- Site Contracts
Cycle Time Metrix

Evaluate total trial durations and key clinical trial processes or even better, create custom cycle time analyses with ease; compare cycle times using the criteria important to you including phase, patient type, disease and geography


